Customization
Overview
The customization component is divided into sections accessible on the right.
It is used for data manipulation as well as visual customization. Depending on the type of customization you choose, the corresponding features will be displayed.
Here is the data manipulation:
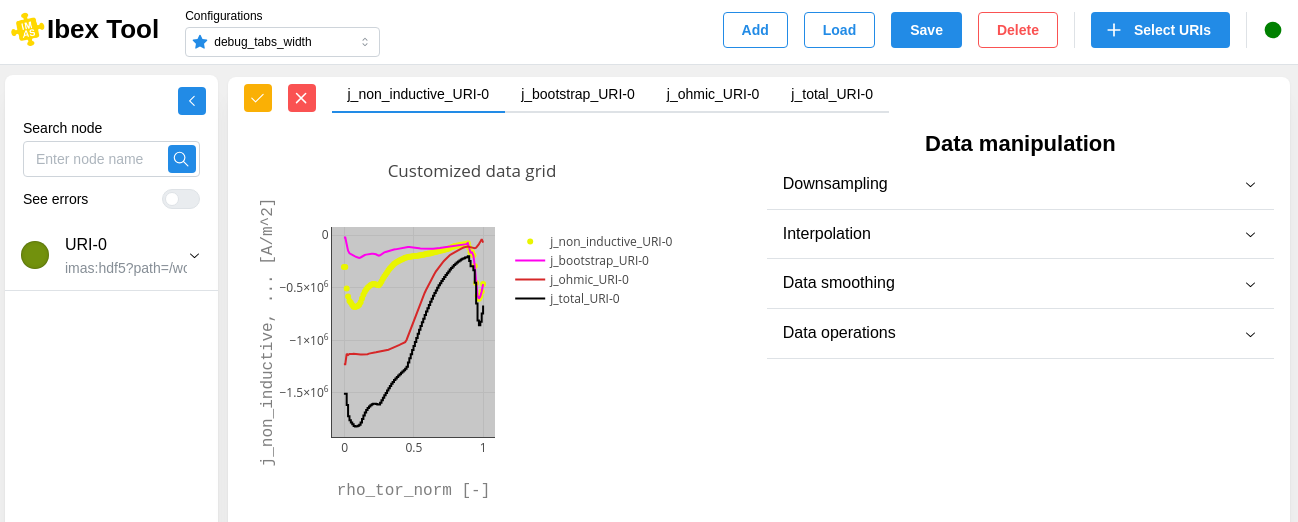
And here is the visual customization:
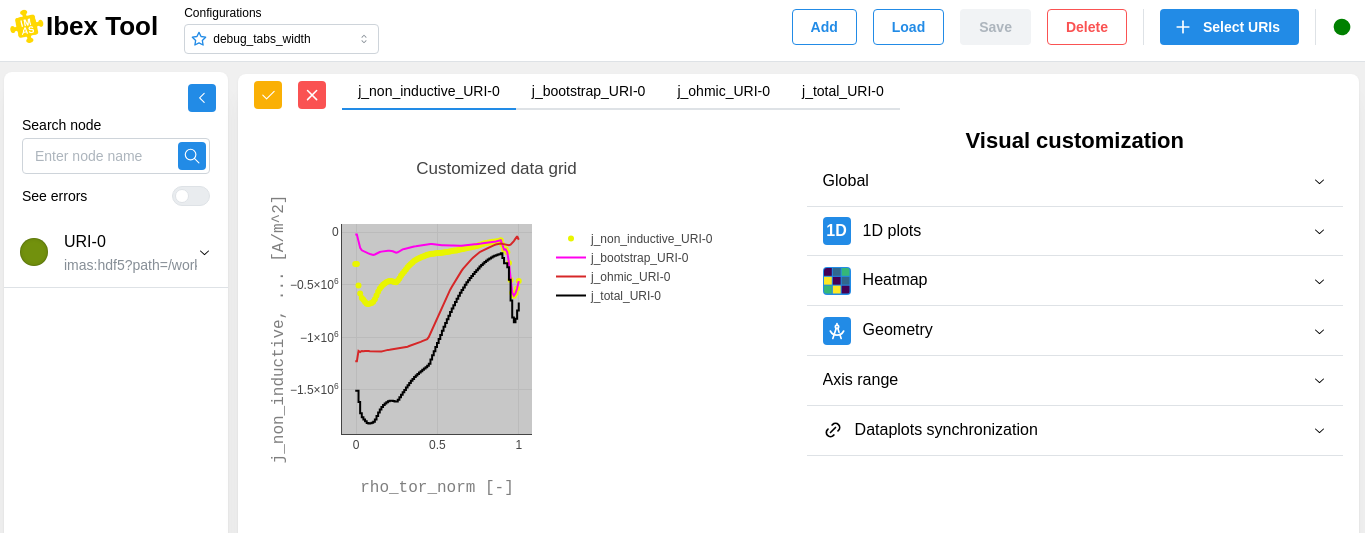
When you make changes, you can see the updates reflected in the graph on the left.
You can undo changes by clicking the button with the red X in the upper-left corner. Otherwise, simply click the button with the orange checkmark to apply the customization.
Data manipulation
Downsampling
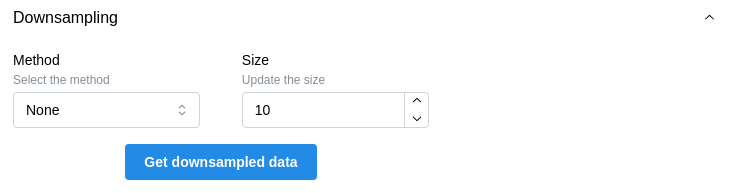
Applies a downsampling method to reduce the data size while preserving its original appearance:
Interpolation
Applies an interpolation method to fill gaps between data points by estimating intermediate values:

Data smoothing
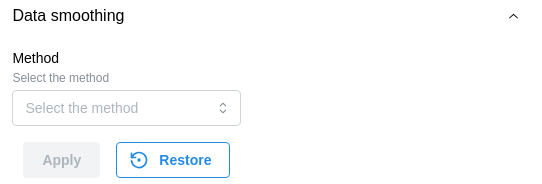
Applies a smoothing method to reduce noise while preserving the overall shape of the signal. Depending of the selected method, related parameters are displayed:
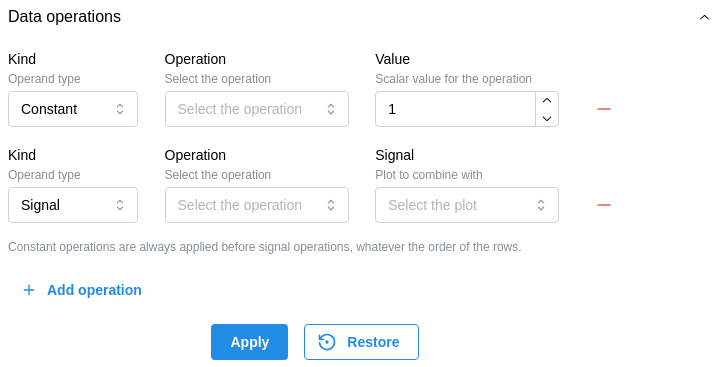
Data operations
Applies an ordered list of operations to every data point of the plot. Each row has a kind, which decides what the plot is combined with:
Constant: a scalar value that you type in. Available operations are addition, subtraction, multiplication, division, exponentiation and nth root.
Signal: another plot of the same graph, combined point by point. Available operations are addition, subtraction, multiplication and division. This kind requires at least two plots in the graph, otherwise it stays disabled.
A few things to keep in mind when combining two signals:
All constant operations are applied before all signal operations, whatever the order of the rows.
Both signals must share the same shape and the same coordinates. When they do not, either select an interpolation method in the Interpolation section or the server reports which of the two has to be interpolated.
An addition or a subtraction requires both signals to share the same unit, while a multiplication or a division combines them (for example
mandsbecomem/s).
Visual customization
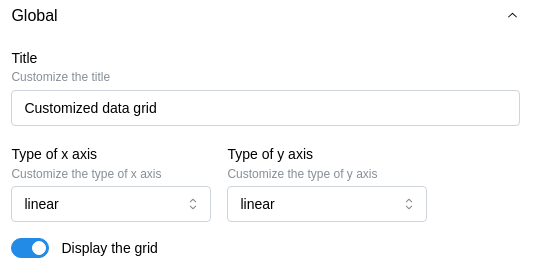
Global
Allows you to modify general parameters of a graph:
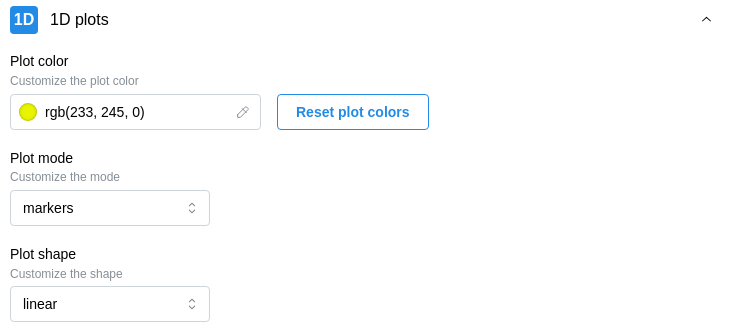
1D plots
Allows you to customize the appearance of 1D plots:
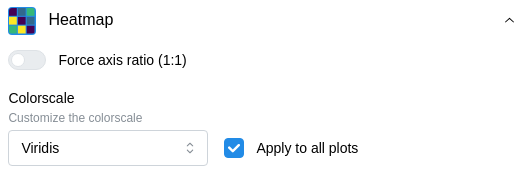
Heatmap
The Force axis ratio (1:1) switch locks the x and y axes to the same scale. It is by default set to true if x and y axis share the same units in 2D plots. You can also modify the color scale of the heatmap:
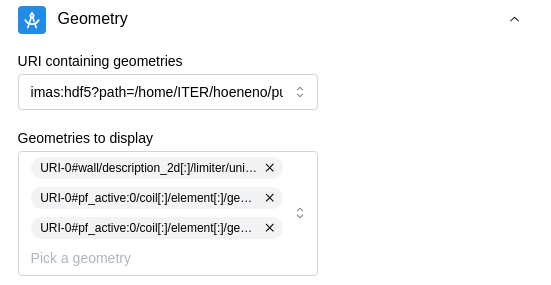
Geometry
Allows you to overlay geometries:
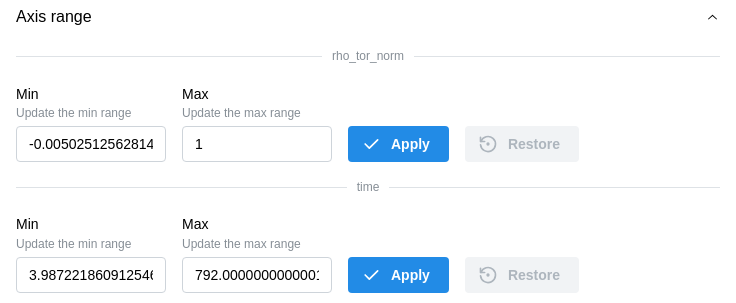
Axis range
Allows you to trim data for a more detailed visualization:
Dataplot synchronization
Allows you to link plots by their coordinates to facilitate comparison when using sliders:
